
Trend Monitoring
JArchitect lets create trend charts. Trend charts are made of trend metrics values logged over time at analysis time. More than 50 trend metrics are available per default and it is easy to create your own trend metrics.
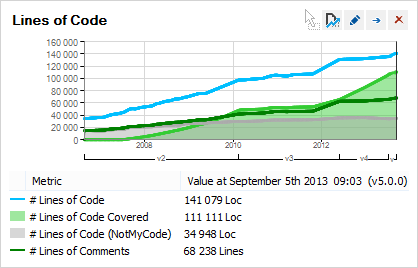
Trend charts are displayed on the JArchitect dashboard. Some trend charts are available per default to show:
- Lines of code,
- Number of Code Rules Violated and number of Code Rules Violations,
- Max and Average values for various Code Quality Metrics,
- Third-Party Usage.
Trend charts can be customized and it is easy to create your own trend charts to show default trend metrics and/or custom trend metrics.

Measuring a code base trends with JArchitect comes with many flexible sub-features:
- Lines of code,
- Trend charts can be created and customized,
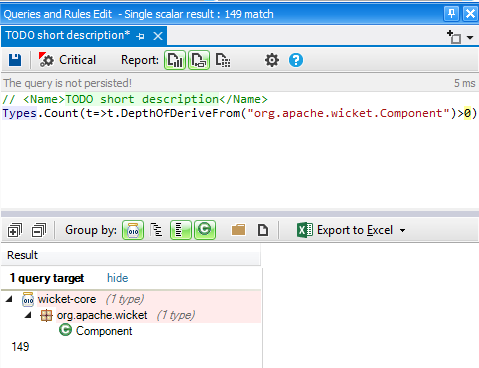
- New Trend metrics can be written through CQLinq queries.
Trend charts can be displayed and analyzed both in the main JArchitect UI and in the reports.